



Why sales teams need OKRs
Sales teams are drowning in metrics. Most have a CRM dashboard with many fields, a weekly forecast call, a monthly pipeline review, quarterly business reviews, and at least one revenue number that every conversation eventually returns to. The data is not the problem.
The problem is that most of those numbers tell you what happened. Very few tell you what to change before the quarter ends.
OKRs are not another reporting layer. When they are used well, they are the mechanism that connects strategic priorities to the decisions a sales team makes on a day to day basis. They answer a different question than quota: not ‘are we on track to hit the number?’ but ‘what do we need to change, and is it working?’
For sales leaders, that shift is significant. Quota measures where you ended up. OKRs give you a system for getting there differently. The framework works in commercial environments, but it requires some deliberate adaptation. This guide covers what that looks like.
If you are in a hurry: Jump directly to Section 3 for the KR writing formula and sales-specific examples. Section 9 has ready-to-use OKR templates adapted for sales teams.
Defining key sales OKR terms
These terms are used consistently throughout this guide. OKRs and initiatives are covered in full in The Fundamentals of OKRs; the recap below is deliberately brief and focused on how they apply in a sales context, alongside the sales-specific metrics this guide relies on.
| Term | Definition |
| Objective | A short, qualitative statement of the outcome you want by the end of the cycle. Directional, and time-bound. |
| Key Result | Measurable, outcome-focused evidence that the Objective is being achieved, not a task to complete. |
| Initiative | Work chosen to influence a Key Result: prospecting campaigns, enablement programs, process changes. |
| KPI | An ongoing metric used to monitor business performance. Quota attainment, monthly revenue, churn rate. Stays stable across cycles. |
| Leading indicator | A metric that predicts a future outcome and is available early enough in the cycle to support a change of direction. |
| Lagging indicator | A metric that shows a result after the fact. Revenue and closed deals are typical lagging indicators in a sales context. |
| Pipeline coverage ratio | The ratio of pipeline value to revenue target. A leading indicator of whether the team has enough opportunity to hit quota. |
| SQL-to-close rate | The proportion of sales-qualified leads that convert to closed business. A pipeline quality signal. |
| Cadence | The repeatable operating rhythm that keeps OKRs alive: weekly check-in, end-of-cycle review, retrospective. |
OKR Mentors Core Principles
Three core principles carry particular weight in a sales context.
- Outcomes over outputs. If you can finish it with no measurable change, it is not a Key Result. In sales, this means calls made, emails sent, and proposals delivered belong in initiatives. What belongs in a Key Result is the movement those activities are intended to create: meetings booked, pipeline quality improved, cycle length shortened.
- Evidence over opinions. Every Key Result has a definition and a source. In a sales environment, that means being precise about what counts as a qualified lead, what the baseline pipeline coverage is, and where the data comes from. Sales teams often have good instincts about the pipeline. OKRs ask those instincts to become measurable commitments.
- Cadence with consequences. Weekly check-ins must produce a decision when confidence is amber or red. In a sales context, this is where OKRs earn their value. A check-in that surfaces a pipeline coverage shortfall in week three, and produces a decision about which segment or channel to prioritize, is worth every minute it takes.
What makes sales OKRs different
Most sales organizations already have a goal system. They just do not call it that. Quota is the goal. KPIs are the measurement. The CRM is the source of truth. Check-ins happen every week on the forecast call. It works, up to a point.
The limitation is not the rigor, it is the horizon. Quota tells a sales team what the destination is. It does not tell them which road to take, or when to change route if the current one is leading somewhere slower.
OKRs fill that gap. They work alongside quota and KPIs rather than replacing them. The job they do is different: they focus the team on the specific outcomes that need to change this cycle in order to get to the destination more reliably.
Why revenue is not an OKR
The most common mistake sales leaders make when first writing OKRs is treating revenue targets as Objectives and quota attainment as a Key Result. It is understandable. Revenue is the most important number. But it is already a KPI.
The distinction matters because OKRs are designed to drive change, not monitor performance. A revenue target tells you where the bar is. An OKR asks: what needs to be different about how the team operates in order to clear it?
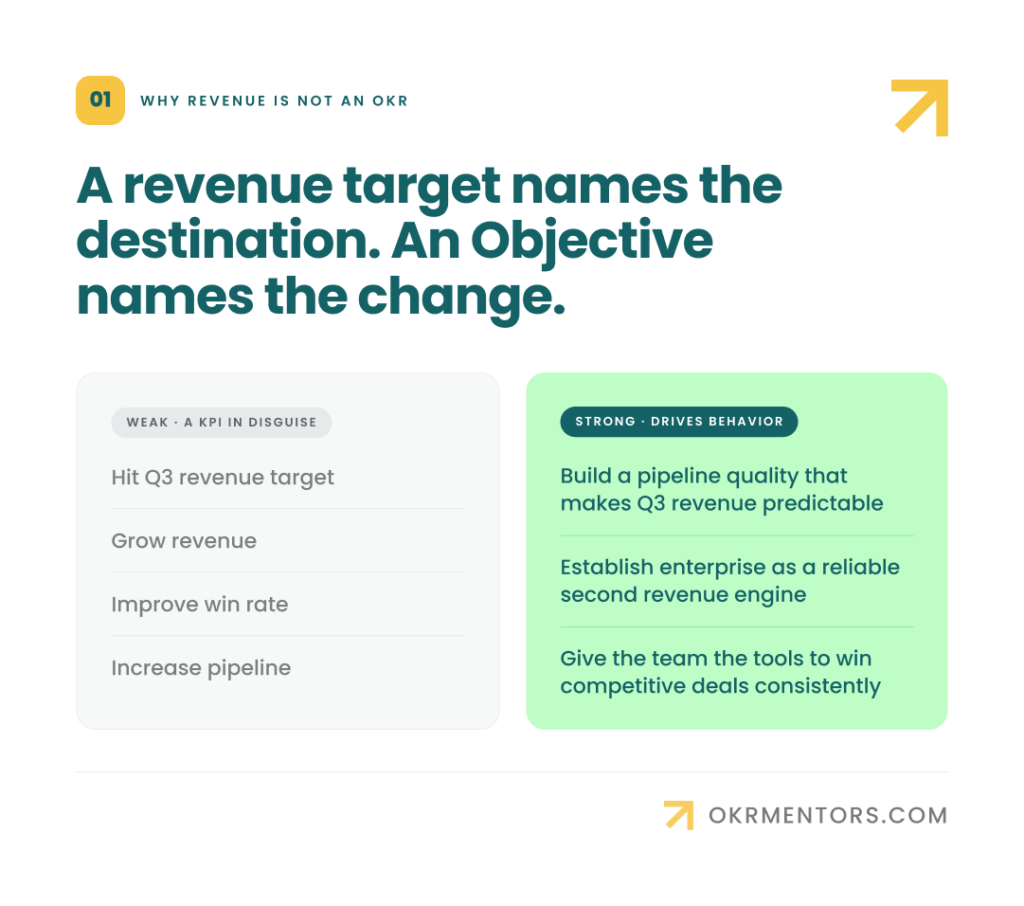
The pattern is the same in each case. The weak version describes a destination. The strong version describes a change in how the team gets there.
Why sales activity belongs in initiatives, not Key Results
Sales teams are wired to track activity. Calls made, emails sent, meetings booked, proposals submitted. These are visible, countable, and within the team’s direct control. They make natural candidates but are not Key Results, they are initiatives.
An initiative is the work the team chooses to do in order to move a Key Result. It belongs in a separate plan that sits below the OKR. The reason for the separation is important: the team should be able to change an initiative mid-cycle if it is not working, without having to rewrite the goal. If the activity is the goal, there is no room to adapt.
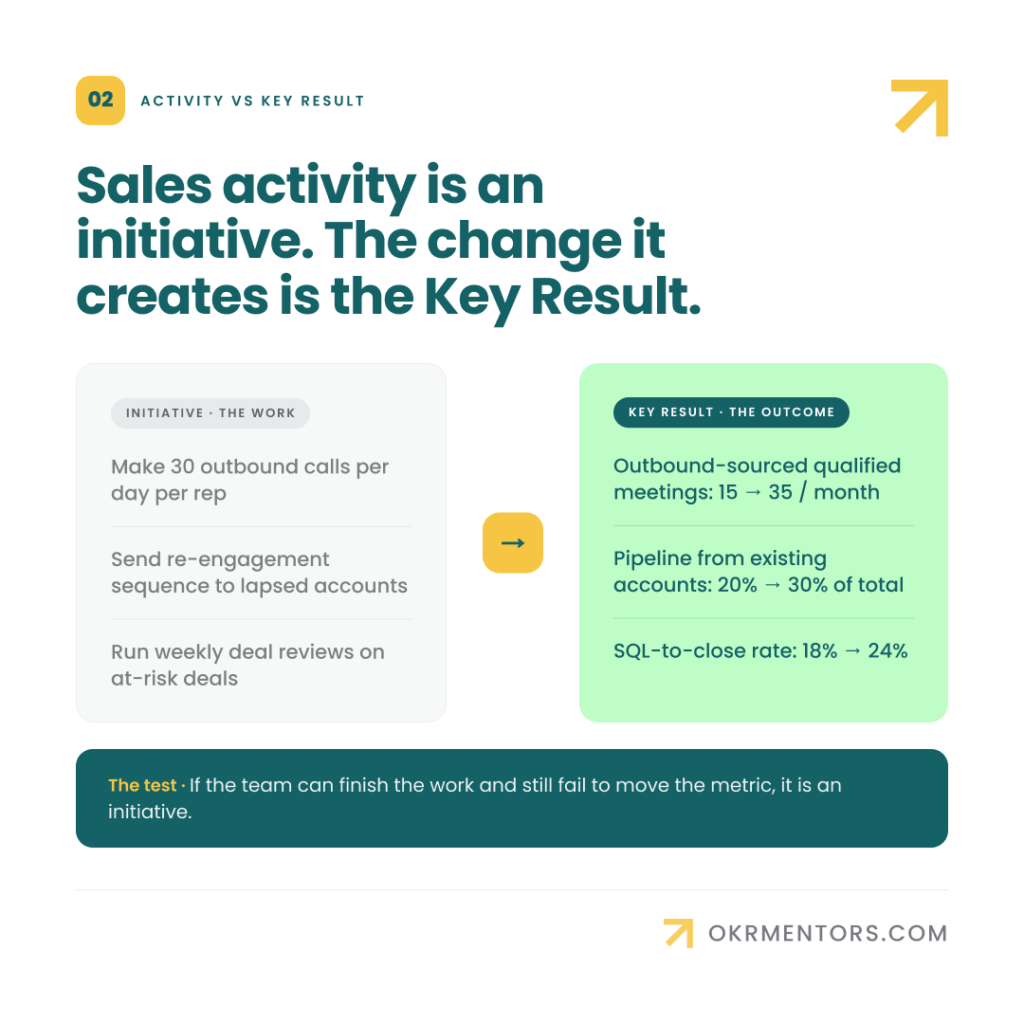
The test is simple: If the team can complete the work and still fail to improve the metric, it is an initiative. If it measures a change in results, it is a Key Result.
What OKRs add to a sales team that quota does not
Quota sets the target. OKRs set the direction of change. The two are not in conflict, but they answer different questions.
Quota asks: did we hit the number? OKRs ask: what did we change in how we operate, and did it work? That second question is where most sales teams have a gap. It is also where most of the value in OKRs lives.
In practice, well-designed sales OKRs give leaders a system for tracking not just whether the team is on track, but why. A team can be on track for quota in week six and still have a pipeline coverage problem that will surface in week ten. OKRs make that visible early enough to do something about it.
The quota problem: how OKRs and performance management coexist
The single biggest tension in sales OKR implementations is not the writing. It is the relationship between OKRs and compensation.
Sales teams already have a performance management system. It is called quota. Every rep knows that their pay is tied to their number. When OKRs are introduced on top of that system, two failure modes emerge almost immediately.
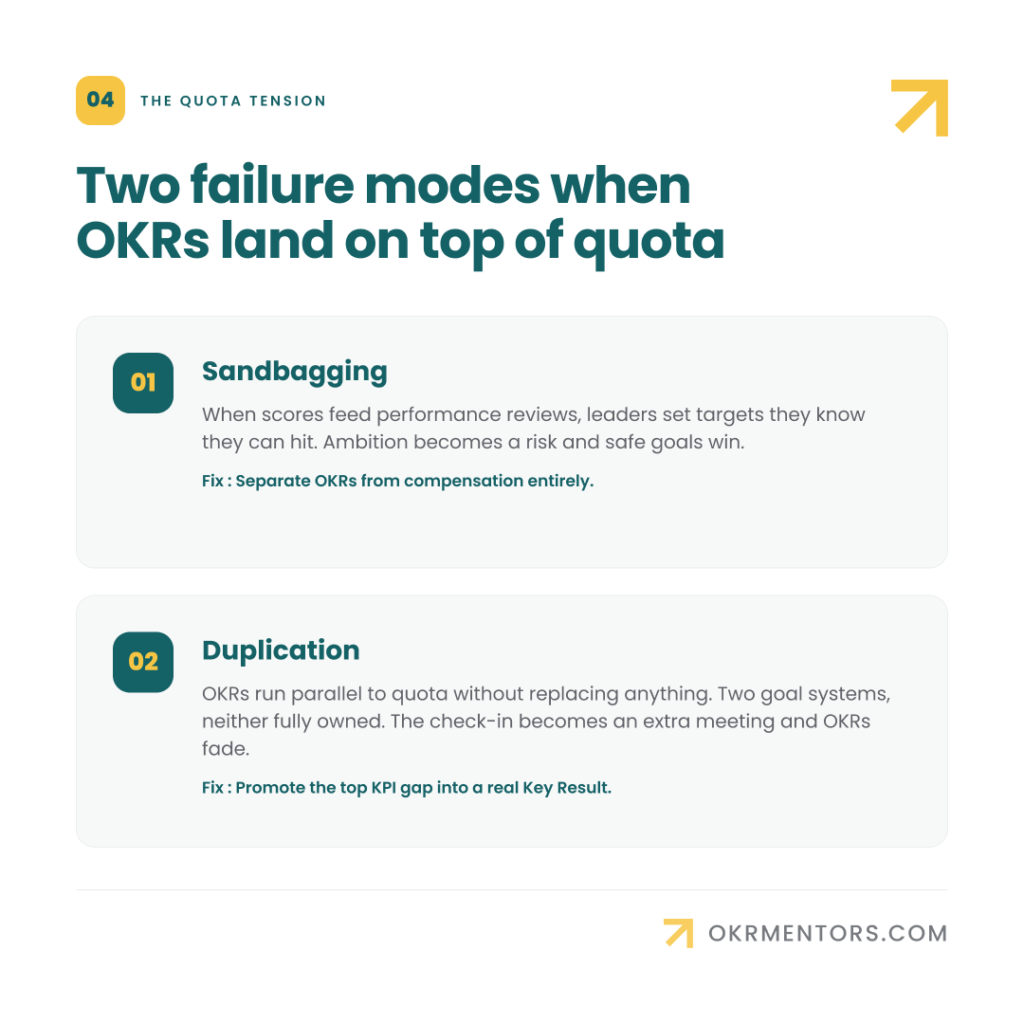
Failure mode 1: sandbagging
When OKR scores feed into performance conversations or are visible to managers as a proxy for performance, sales leaders set targets they know they can hit. Ambitious OKRs become a risk. Sandbagging becomes rational. The framework produces safe, predictable scores rather than honest goal-setting.
This is not a character problem. It is a design problem. OKRs should be separated from performance management. When they are linked, teams set safe targets rather than ambitious ones.
Failure mode 2: duplication
The second failure mode is treating OKRs as a parallel system that sits alongside quota attainment without replacing or simplifying anything. Teams end up with two goal systems, neither of which has full commitment. OKR check-ins become an extra meeting. The CRM is still the source of truth for everything that actually matters. OKRs fade.
How to keep them separate in practice
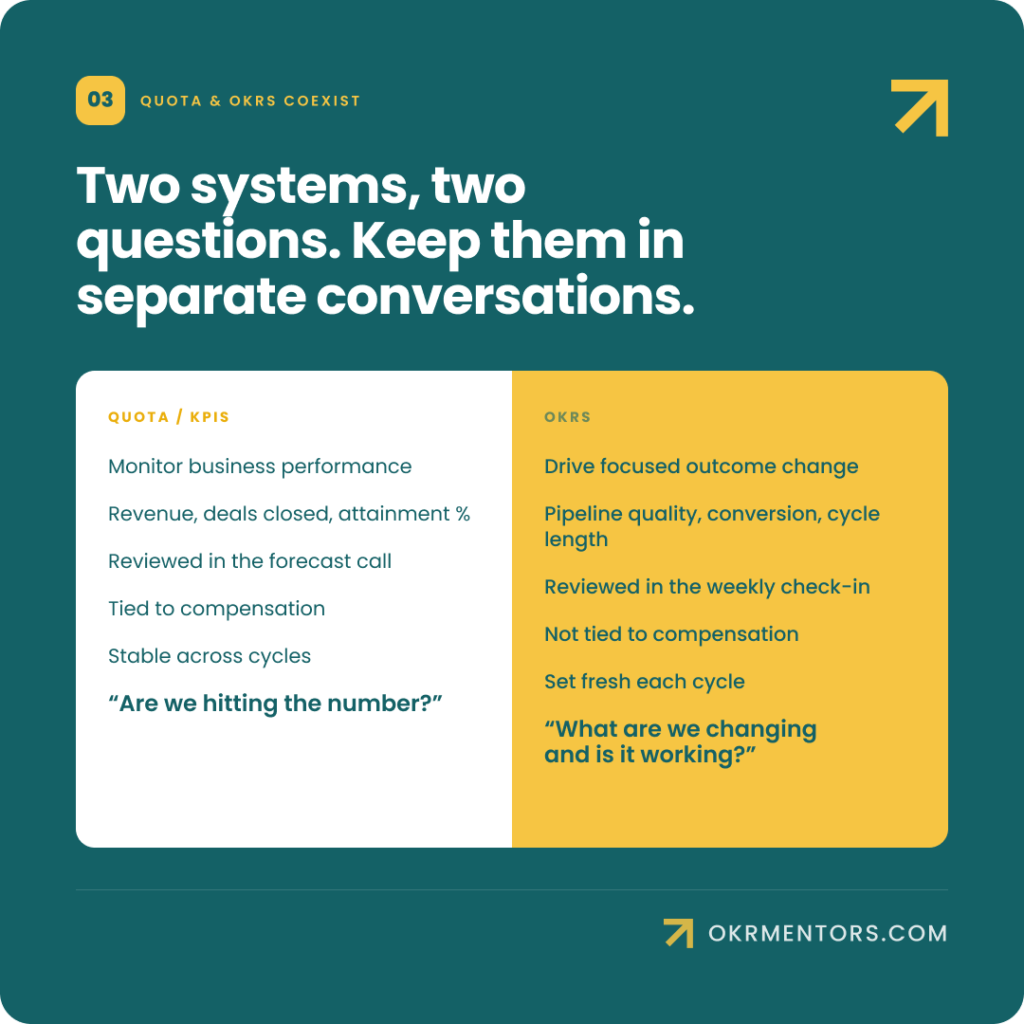
The design principle is straightforward: quota is a KPI that monitors business performance. OKRs are time-bound change goals. They measure different things and should live in different conversations.
| Quota / KPIs | OKRs |
| Monitor business performance | Drive focused outcome change this cycle |
| Revenue, deals closed, attainment % | Pipeline quality, conversion rate, cycle length |
| Reviewed in forecast call | Reviewed in weekly OKR check-in |
| Tied to compensation | Not directly tied to compensation |
| Stable across cycles | Set fresh each cycle |
| Answers: are we hitting the number? | Answers: what are we changing, and is it working? |
OKRs should not directly determine pay, bonuses, or appraisal outcomes. However, they can support performance conversations through a loose link, focused on the quality of an individual’s contribution to strategic priorities, not the number of OKRs owned or the percentage achieved.
A practical rule: if the KPI gap becomes the top priority for the cycle, promote it into a Key Result with a baseline, target, and deadline. Keep the KPI visible on the dashboard. The OKR is the change commitment for this cycle. The KPI is the business health signal that remains after the cycle ends.
Example
The pipeline coverage KPI has been sitting at 1.8x for three quarters. Leadership has identified it as the primary risk to the annual revenue target.
In Q3, it is promoted into a Key Result: Increase qualified pipeline coverage from 1.8x to 3.0x of next-quarter target by end of Q3. The KPI stays on the dashboard at 1.8x.
The Key Result is the team’s commitment to move it. At the end of Q3, if it reaches 3.0x, it returns to the dashboard as a health metric and ceases to be an active OKR priority unless another gap appears.
Should sales reps have individual OKRS?
Individual OKRs are optional in any OKR implementation, and they carry additional risk in a sales context. Sales reps already have individual targets. Adding individual OKRs on top creates two problems: it fragments the team’s focus, and it almost inevitably pulls OKRs into performance management.
The recommendation for most sales teams is to start at the team level. Team OKRs build shared accountability, create a common language for priorities, and avoid the performance management entanglement that individual OKRs invite. Individual OKRs can be introduced in more mature implementations where the team level is already working well, but they should remain clearly separated from compensation and used, at most, as qualitative evidence of contribution to strategic execution.
How to write sales OKRs that work
Writing a strong sales Objective
A good Objective describes the outcome the team wants by the end of the cycle. It is qualitative, directional, and specific enough that measurable Key Results naturally sit beneath it.
For a sales team, a strong Objective usually points at one of three things: the quality of the pipeline, the effectiveness of the team’s process, or the strategic position the team is trying to build. It does not describe a revenue number.
Quick Test
Can you describe success without naming a revenue figure or an activity? If not, the Objective is either a KPI or a project.
Writing strong Key Results for a sales team
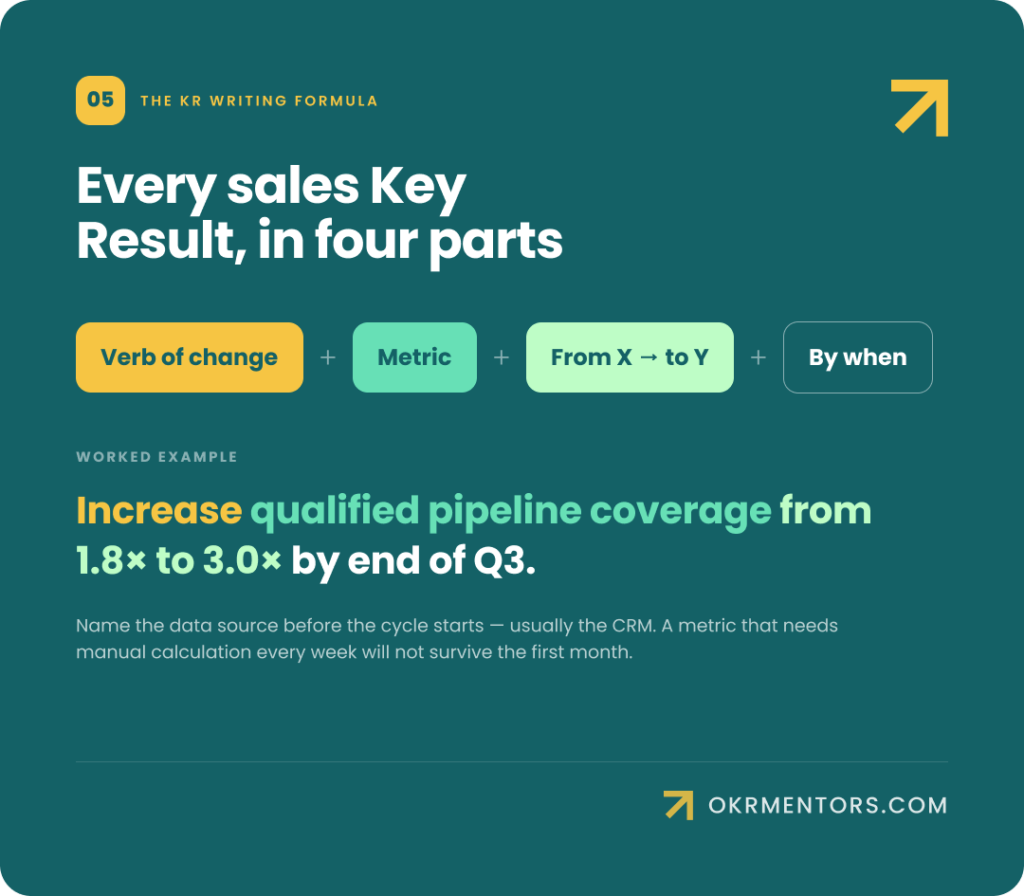
A Key Result defines measurable evidence that the Objective is progressing. The most useful format:
A useful way to write a Key Result is:
verb of change + metric + from X to Y + by when
For example:
- Increase qualified pipeline coverage from 1.8x to 3.0x by end of Q3.
- Improve SQL-to-close rate from 18% to 24% by end of Q2.
- Reduce median sales cycle length from 52 days to 45 days by end of Q3.
In a sales context, that structure is what makes a Key Result easy to track on the team’s weekly rhythm and easy to discuss with evidence in a check-in rather than by opinion. A good Key Result makes explicit what will change, how it will be measured, where the team starts, where it intends to get to, and by when.
For each Key Result, name the data source before the cycle starts. In a sales context, that is usually the CRM. If the data is not currently tracked, either find a proxy that is, or add the tracking before the cycle begins. A metric that requires manual calculation every week will not survive the first month.
Sales team OKR example
Objective: Build a healthier pipeline that supports predictable growth.
Key Results:
- KR 1: Increase qualified pipeline coverage from 2.0x to 3.0x of next-quarter target.
- KR 2: Improve SQL-to-close rate from 18% to 24%.
- KR 3: Reduce median sales cycle length from 52 days to 45 days.
Initiatives (separate from the OKR): Refresh the ideal customer profileRoll out updated stage-exit criteriaRun a sales enablement program on discovery calls
Notice that the initiatives describe work the team will do, while the Key Results describe the outcomes that work is intended to create. If the ICP refresh does not move the pipeline coverage ratio, the team can change the initiative without rewriting the goal.
Weak vs. strong Key Results for sales teams
| Weak Key Result (task or output) | Strong Key Result (outcome) |
| Make 30 outbound calls per day | Increase outbound-sourced qualified meetings from 15 to 35 per month |
| Send re-engagement emails to lapsed accounts | Increase pipeline from existing accounts from $400K to $650K |
| Update the sales playbook | Improve new rep ramp time from 90 days to 60 days |
| Attend 3 industry events this quarter | Generate 12 qualified introductions from events and partnerships |
| Implement deal review process | Improve SQL-to-close rate from 18% to 24% |
Leading and lagging indicators for sales teams
This is the part of OKR design that most sales teams skip, and it is the part that determines whether the framework is useful during the cycle or only at the end of it.
Why revenue is a lagging indicator
Revenue tells you what happened after the cycle. By the time the number is clear, the quarter is over. There is nothing to adapt to. For a sales team, this means that if the only Key Result is a revenue figure, the OKR check-ins have no decision-making power. Everything is on track until it suddenly is not.
The solution is to include at least one leading indicator alongside any lagging outcome. Leading indicators show up earlier in the cycle. They give the team time to see a problem and change direction before it becomes a miss.
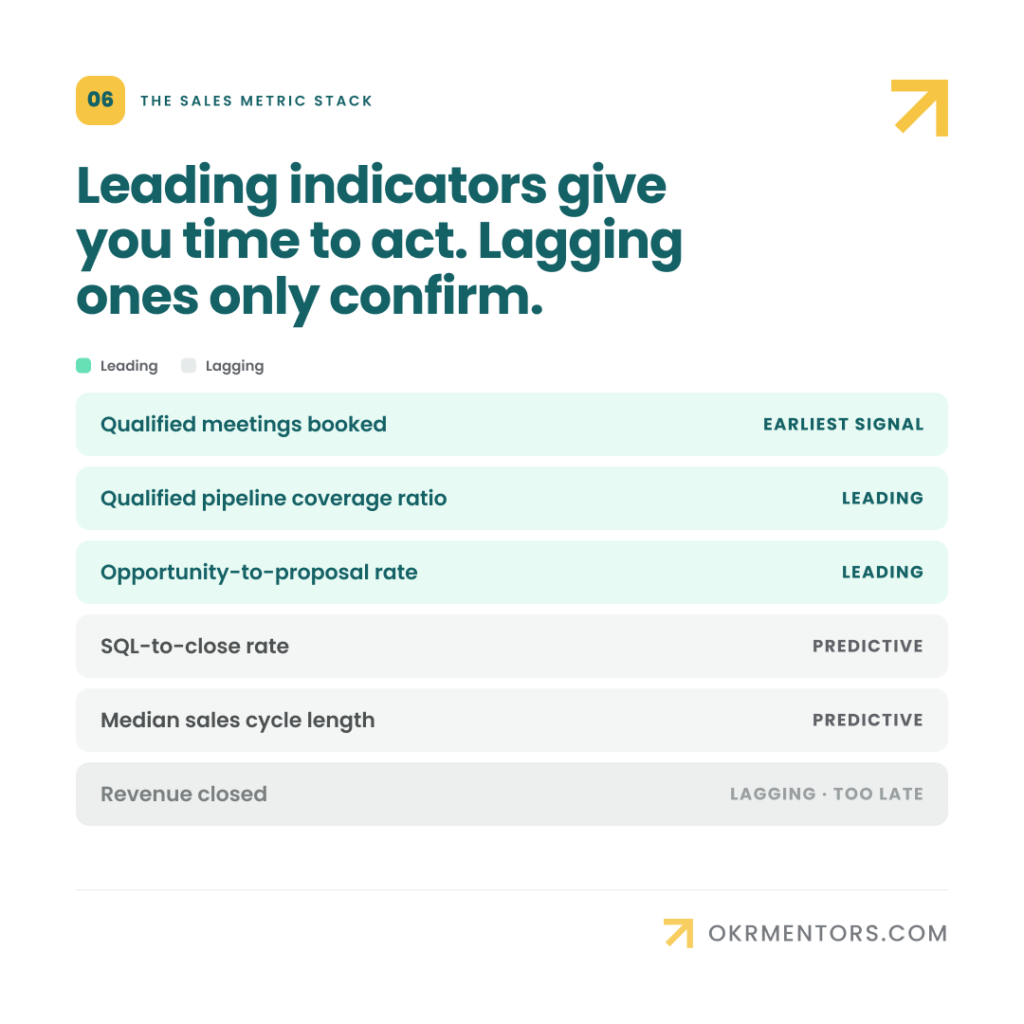
Which sales metrics are leading vs lagging indicators?
Here is how the typical sales metric stack maps to leading and lagging positions.
| Metric | Type | Why it matters in OKR design |
| Revenue closed | Lagging | The destination. Useful as context, rarely useful as a Key Result because it arrives too late to course-correct. |
| Qualified pipeline coverage ratio | Leading | Shows whether enough opportunity exists to hit quota. Visible weeks before close. |
| SQL-to-close rate | Leading / lagging | Measures pipeline quality. Changes more slowly but is predictive of future close rates. |
| Median sales cycle length | Leading / lagging | A shortening cycle length often predicts revenue improvement. Visible before close. |
| New meetings booked (qualified) | Leading | The earliest upstream signal. Predictive of pipeline build in 4-6 weeks. |
| Opportunity-to-proposal rate | Leading | Measures how effectively discovery converts to active deals. |
| Average deal value | Lagging | Revenue-adjacent. Changes slowly. Better as a KPI than a quarterly Key Result. |
How to choose the right leading indicator
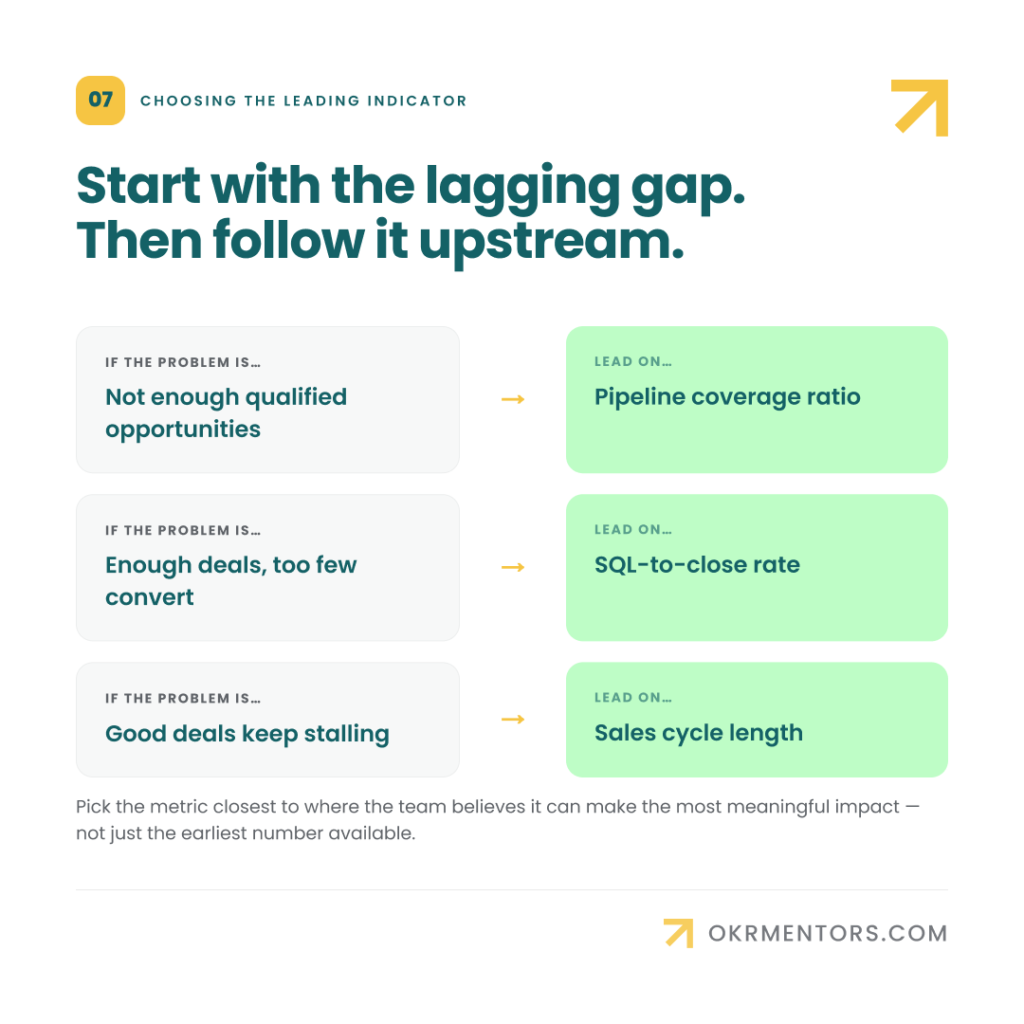
The starting point is usually the lagging metric: revenue, quota attainment, closed deals, or segment growth. From there, ask what earlier behaviour or system change is most likely to influence that result within the cycle. The right leading indicator is not just the earliest number available. It is the metric that sits closest to where the team believes it can make the most meaningful impact.
For example, if revenue is behind because there are not enough qualified opportunities, pipeline coverage may be the right leading indicator. If there are enough opportunities but too few convert, SQL-to-close rate may be more useful. If good opportunities are stalling, sales cycle length or stage progression may be the better signal. The lead metric should therefore be chosen based on the point in the sales process where the team wants to drive behavioural and substantial change that will eventually influence the lagging outcome.
How many leading vs lagging KRs should a sales OKR set have?
The OKR Mentors guidance on leading and lagging indicators, defined in full in The Fundamentals of OKRs, is clear: if the main success outcome is lagging, include at least one earlier signal so the team can adapt before the cycle ends. For a sales team, that usually means:
- One pipeline quality metric (leading): coverage ratio, SQL-to-close rate, or cycle length.
- One pipeline build metric (leading): qualified meetings booked, opportunity conversion rate.
- Optionally, one outcome metric (lagging): closed revenue from a specific segment, if the cycle is long enough to see it move.
The goal is not to add more Key Results. The goal is to add one earlier signal that helps the team make a decision before the quarter ends.
Leading and lagging patterns in practice:
Lagging KR: Increase enterprise segment closed revenue from $180K to $280K.
Leading KR: Increase qualified pipeline coverage in enterprise from 1.6x to 2.8x.
The leading KR gives the team a check week by week. If coverage is at 1.9x rather than getting closer to 2.8x, the team has time to add pipeline before the lagging outcome is determined. Without the leading KR, the same shortfall only becomes visible at the end of the period.
Aligning sales team OKRs to company priorities
Sales OKRs do not exist in isolation. They should connect upward to company priorities and horizontally to the functions the sales team depends on: marketing for pipeline quality and lead generation, customer success for retention and expansion, and product for the value proposition being sold.
Connecting sales OKRs to company OKRs
Each sales team OKR should be traceable to at least one company-level priority. If a sales OKR cannot connect to the company direction, it is worth asking whether it belongs in the cycle at all.
The most effective way to make this visible is to ask the alignment question during the OKR definition session: which company OKR does this Key Result support? If the answer is not immediate, the team has not finished the alignment work.
Horizontal alignment: sales, marketing, and customer success
Vertical alignment (sales team to company) is the obvious one. Horizontal alignment is where most implementations have a gap.
A sales team’s pipeline quality OKR depends on marketing’s lead quality. A customer success expansion’s OKR depends on sales handoff quality. When each team writes OKRs in isolation, those dependencies become invisible until they become problems.
The practical fix is to run a brief horizontal alignment check before the cycle starts. For each Key Result that depends on another team’s work, ask: does that team have a corresponding OKR that supports this outcome? If not, raise it before the cycle begins rather than discovering the gap in week five.
| Sales team Key Result | Dependency to check |
| Increase qualified pipeline coverage from 1.8x to 3.0x | Marketing: are inbound lead volume and quality targets aligned? |
| Improve SQL-to-close rate from 18% to 24% | Sales enablement: does the team have updated playbooks and training? |
| Increase expansion revenue from existing accounts by 25% | Customer success: is the renewal and upsell process aligned? |
| Reduce average sales cycle from 52 to 45 days | Product: are demo and proof-of-concept materials up to date? |
Running the cadence: check-ins that fit how sales teams work
OKRs are not a once-a-quarter exercise. The framework only delivers value when it is connected to a regular check-in rhythm that produces decisions. For sales teams, that rhythm needs to fit the way the team already operates rather than creating a new meeting structure on top of an already full calendar.
Can quarterly OKRs work when sales resets monthly?
Many sales teams operate on a monthly performance rhythm. Pipeline is reviewed monthly. Attainment is tracked monthly. For some teams, the entire sales psychology resets on the first of every month.
A quarterly OKR cycle can feel abstract in that environment. Long-term strategic goals are difficult to sustain when the immediate pressure is this month’s number. Teams that reset to an empty pipeline at the start of each month often find it difficult to hold focus on longer-term objectives while short-term delivery pressure is constant.
The answer is not to abandon quarterly OKRs. It is to design a check-in rhythm that bridges the monthly and quarterly views.
A check-in rhythm for sales teams
The OKR Mentors standard check-in guidance, set out in How to Implement OKRs, calls for weekly check-ins that are short, decision-oriented, and embedded in existing meetings rather than scheduled separately. For a sales team, the recommended adaptation is:
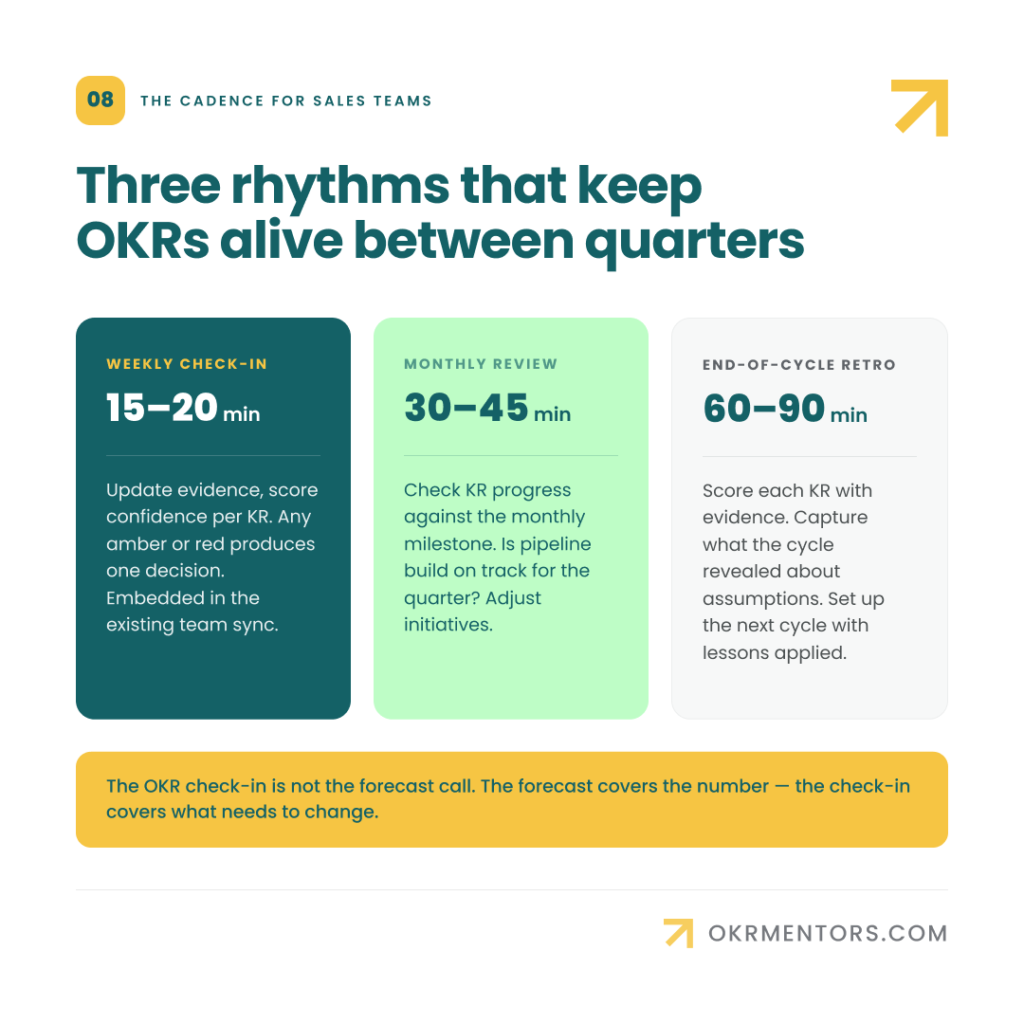
The weekly check-in should not duplicate the forecast call. The forecast call covers the number. The OKR check-in covers what needs to change in how the team operates.
What a good sales OKR check-in produces
The three questions that drive an effective check-in apply directly to a sales context:
- What does the evidence say about each Key Result today?
- What is preventing progress?
- What will we change before next week?
The third question is the one most check-ins skip. A check-in that updates the numbers and ends without a decision is not doing the job. If a pipeline coverage KR is amber in week four, the check-in should produce at least one of: a decision to redirect prospecting effort, a specific ask for help from marketing, or a trade-off between two current initiatives.
Confidence levels are the mechanism that triggers this. When every KR is green, the check-in can be brief. When a KR drops to amber or red, the check-in must produce a decision before it closes.
Common mistakes sales leaders make
Most OKR mistakes in sales teams are not technical. They are cultural. They reflect the habits and incentive structures that already exist in the function rather than misunderstandings of the framework.
| Mistake | What it looks like in a sales context | How to fix it |
| Key Results are activities | KRs list calls, emails, meetings attended, proposals submitted | Rewrite as outcome evidence. Ask: what changes if this activity succeeds? That change is the KR. |
| Revenue target as Key Result | KR 1: Hit $1.2M revenue in Q3 | Keep revenue as a KPI on the dashboard. Promote it to a Key Result only if it becomes the top change priority, with a baseline, target, and deadline. |
| Sandbagging under quota pressure | Goals set low enough to guarantee 100% score every cycle | Separate OKRs from compensation conversations entirely. Make it safe to set ambitious targets by treating misses as learning signals, not judgment. |
| OKRs tied to rep performance | OKR scores appear in performance reviews or manager scorecards for individual reps | Keep OKRs at team level. Remove OKR scores from any process connected to compensation or appraisal. |
| Disconnected from marketing | Sales OKRs assume lead volume the marketing team has not committed to | Run a horizontal alignment check before the cycle starts. Surface dependencies before they become blockers. |
| Check-ins are forecast updates | The weekly OKR check-in becomes a pipeline review with no connection to Key Result evidence | Separate the conversations. Forecast call covers the number. OKR check-in covers what needs to change and what decision the team is making this week. |
| Too many OKRs | Every sales priority gets an Objective; teams track 15 Key Results | Cut to 1-3 Objectives with 2-5 Key Results each. OKRs are a focus mechanism. If the team cannot recall their priorities without looking them up, the set is too large. |
A note on the first cycle
The first cycle of sales’ OKRs will not be perfect. Key Results will be written as activities and revised at the first check-in. Confidence scores will feel unfamiliar. The check-in format will take two or three rounds to feel natural.
That is normal. The value of the first cycle is not in the scores. It is in what the team learns about how to set better Key Results, which metrics are actually available in the CRM, and where the real bottlenecks in the pipeline sit. Treat the first cycle as a diagnostic. The second cycle will be meaningfully better.
Practical steps and templates
Sales leader quick-start checklist
Use this checklist before the cycle starts and again in week two to catch drift early.
- Strategy is clear: the team can connect its OKRs to at least one company-level priority.
- Revenue targets and quota are kept separate from OKR Key Results.
- Each Key Result follows the formula: verb of change + metric + from X to Y + by when.
- Each Key Result has a named data source (usually the CRM).
- At least one Key Result is a leading indicator visible before week eight.
- Activities and campaigns are in an initiatives list, not in the OKR.
- The check-in cadence is in the calendar before the cycle starts.
- OKR scores are not connected to any performance management or compensation process.
OKR examples: sales teams
The following examples are drawn from OKR Mentors source materials and adapted for common sales scenarios.
Example 1
Pipeline quality
Objective: Build a healthier pipeline that supports predictable growth.
Key Results
- KR 1: Increase qualified pipeline coverage from 2.0x to 3.0x of next-quarter target.
- KR 2: Improve SQL-to-close rate from 18% to 24%.
- KR 3: Reduce median sales cycle length from 52 days to 45 days.
Initiatives (separate from the OKR):
- Refresh the ideal customer profile
- Roll out updated stage-exit criteria
- Run a sales enablement program on discovery calls
Example 2
Competitive win rate
Objective: Win more competitive deals by giving the team the confidence and tools to sell against alternatives.
Key Results
- KR 1: Increase competitive win rate from 31% to 42%.
- KR 2: Increase proportion of deals with a documented competitive insight from 20% to 65%.
- KR 3: Reduce deal loss rate at late-stage (post-demo) from 38% to 25%.
Initiatives (separate from the OKR):
- Build competitor battle cards for top three alternatives
- Run monthly win/loss debrief sessions
- Update discovery framework to surface competitive situation earlier
Example 3
New business development
Objective: Build a healthier pipeline that supports predictable growth.
Key Results
- KR 1: Increase qualified pipeline coverage from 2.0x to 3.0x of next-quarter target.
- KR 2: Improve SQL-to-close rate from 18% to 24%.
- KR 3: Reduce median sales cycle length from 52 days to 45 days.
Initiatives (separate from the OKR):
- Define mid-market ICP and update CRM segmentation
- Run targeted outbound sequence to top 50 accounts
- Introduce structured qualification framework in discovery calls
Example 4
Sales team capability
Objective: Build a healthier pipeline that supports predictable growth.
Key Results
- KR 1: Increase qualified pipeline coverage from 2.0x to 3.0x of next-quarter target.
- KR 2: Improve SQL-to-close rate from 18% to 24%.
- KR 3: Reduce median sales cycle length from 52 days to 45 days.
Initiatives (separate from the OKR):
- Redesign the first-30-days onboarding experience
- Introduce monthly value-selling coaching sessions
- Implement structured deal review for opportunities above $20K
FAQ: OKRs for sales teams
It can be, but it usually should not be the primary one. Revenue is a lagging indicator that arrives too late in the cycle to support adaptation. If revenue from a specific segment or initiative is the team’s top priority, and the cycle is long enough to see it move, it can be included as one Key Result alongside at least one earlier signal. But using revenue as the only Key Result leaves the team with nothing actionable to discuss until week twelve.
By staying completely separate. Quota is a KPI that monitors business performance. OKRs are change goals that focus the team on what needs to be different this cycle. They live in different conversations and should never be connected to compensation. When they are separated cleanly, they reinforce each other: quota tells the team where the bar is, OKRs tell the team what to change in order to clear it reliably.
Start at the team level. Individual OKRs in a sales context almost always drift into performance management because reps already have individual targets. Team OKRs build shared accountability and avoid the compensation entanglement. Introduce individual OKRs only in mature implementations where the team level is working well, and only where they are clearly separated from any process that affects pay or appraisal.
If the sales cycle is longer than the OKR cycle, the Key Results should track leading indicators rather than closed outcomes. Pipeline coverage ratio, opportunity progression rates, and qualified meeting volume are all observable within a quarter even when closed revenue takes longer. The OKR cycle measures the inputs and the process, not the output that will not be visible for another two quarters.
Yes. The quarterly cadence is a default, not a rule. Organizations with monthly operating rhythms can run monthly OKR cycles with good results, provided the retrospective discipline is maintained at the end of each cycle. The OKR Mentors Global State of OKRs research found that top-performing organizations tend to review progress more frequently, leaning toward a faster check-in rhythm rather than shorter cycles as such. The check-in rhythm should adjust to the shorter cycle, keeping the same decision-forcing structure.
A missed Key Result is a learning signal, not a failure verdict. The right question is: what did the miss reveal about the team’s assumptions, capacity, or process? If the same Key Result is missed repeatedly, the question becomes: is the target realistic, is the data available, and are the right initiatives in place? Treat the retrospective as the mechanism for turning misses into improvements in the next cycle. The value compounds over time, not in the first quarter.
Look for behavioral signals rather than score quality. A team using OKRs well will: change an initiative mid-cycle because the Key Result evidence made it obvious; say ‘that is not in our OKRs’ when a new request arrives and hold the line; surface a confidence drop in week three rather than hiding it until week ten; and produce a check-in decision in under fifteen minutes. Those behaviors are the sign the framework is doing its job.