This is an extract from the Global State of Strategy Execution report. You can read the full version for all dimensions, insights, and benchmarks.
Understanding the dimensions of strategy execution is essential before looking at how organisations actually perform. The SEM360 framework outlines five core dimensions, each describing a critical part of how strategy becomes action: Align, Execute, Improve, Scale, and Empower. These dimensions provide a shared structure for assessing maturity, identifying strengths, and uncovering capability gaps across teams and leadership levels. The SEM360 Dimensions guide explains these foundations in detail. This article builds on that base by exploring how organisations score in practice and what distinguishes the top performers.
Giving teams the autonomy, data, and voice to drive execution.
Key drivers: Team Autonomy, Data & Outcome Mindset.
Empower covers Team Autonomy, Data & Outcome Mindset. High maturity means teams can make decisions, experiment, and learn from failure, backed by data and leadership support. Without empowerment, execution becomes slow, compliance-driven, and disengaged.
Key Insights:
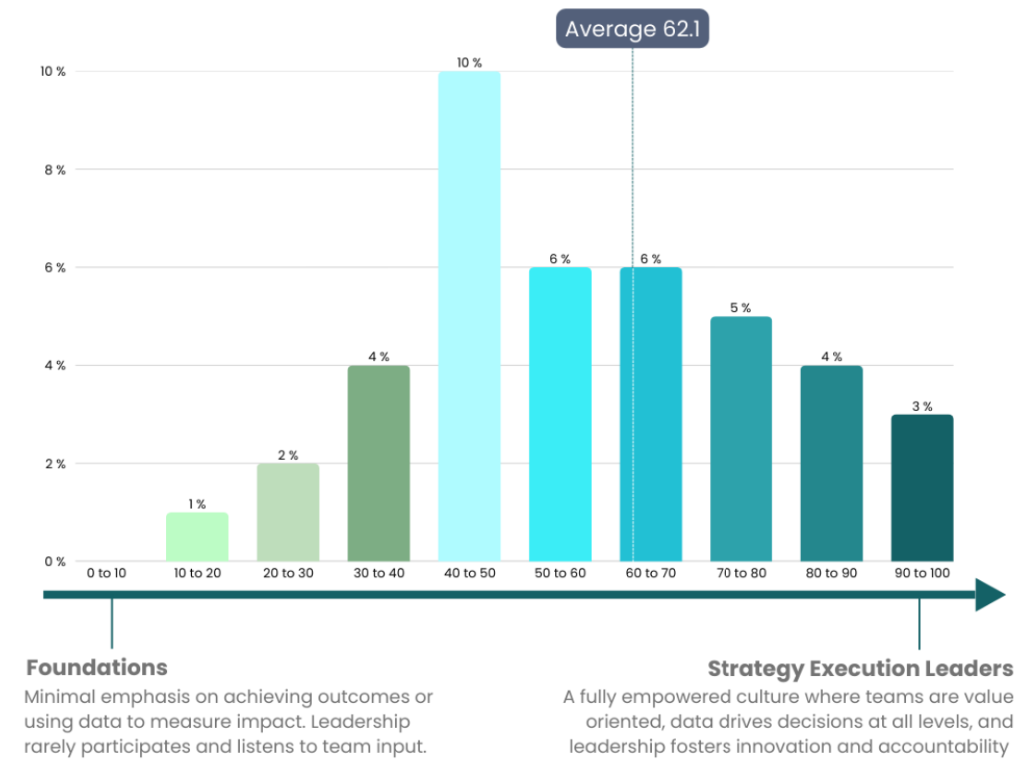
- Empower has an average global score of 62.1, making it stronger than Execute or Scale, but still with large gaps between organizations.
- By industry, Pharma firms lead in Empower with an average score of 66.5, while Automotive companies fall behind at 54.1, reflecting sectoral differences in organizational design.
- Strategy Execution Leaders outperform the global average in Empower score by +30.1 points (92.2 vs 62.1), creating a culture of autonomy at scale.
What Strategy Execution Leaders Do
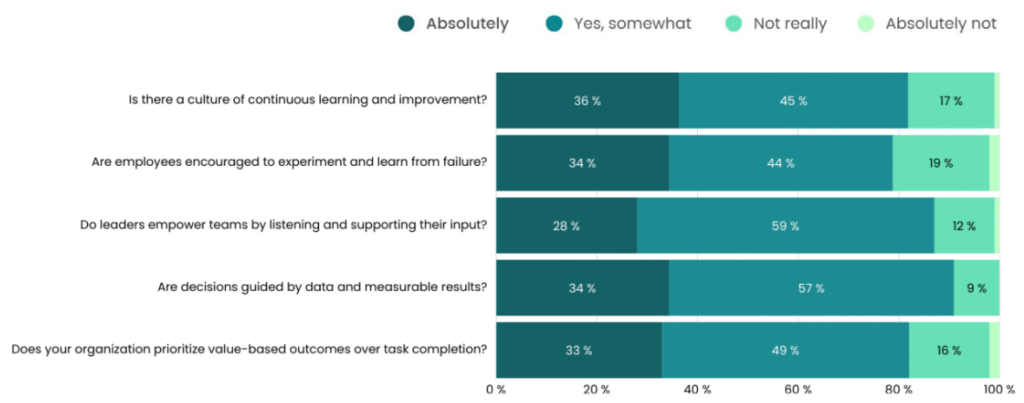
- Measure success by outcomes rather than task completion; they are 2.76× more likely to do so (91% vs 33%).
- Encourage experimentation and learning from failure, 2.06× more likely than peers (91% vs 44%).
- Guide decisions with real-time data and measurable results; Leaders are 2.06× more likely to adopt a data-driven culture (70% vs 34%).
- Foster psychological safety, ensuring employee voice is valued and input shapes strategic decisions.
- Give teams the space to experiment, adapt, and improve execution practices continuously.
- Leaders are 1.3x more likely to us dedicated tools and software during the planning process (57% vs 44%).